RISK ANALYSIS IN INVESTMENT
Why Smart Investors Study Risk Before Return — And How to Do It Right in 2026
By Javeed Dhillon | Investment Risk Analyst & Portfolio Strategist | Updated: May 2026
• Beginner to Advanced
“I was up 60% in 18 months. I thought I had finally figured out the market. Then I lost it all in six weeks — and I still did not understand why.”
That quote is not from some anonymous Reddit user. It describes a pattern that repeats every single market cycle — the overconfident investor who confuses a bull market for personal genius. The FTC reported that Americans lost $5.7 billion to investment fraud and bad decisions in 2024 alone, with the typical victim losing over $9,000. A 2024 survey by Clever Real Estate found that 90% of real estate investors have lost money on at least one deal, and 42% have lost more than they have ever made.
risk analysis in investment. types of investment risk. risk-return tradeoff
What separates the investors who survive — and thrive — from those who blow up their accounts? It is not luck. It is not a hot tip. It is a disciplined, honest approach to risk analysis. Not the sanitized, institutional version you find in textbooks. The real kind — the kind that makes you slow down before you pull the trigger, forces you to ask uncomfortable questions, and keeps you in the game long enough to win.
This guide will give you that. We will go through the mechanics of risk analysis, but more importantly, we will go through the psychology, the mistakes, and the real-world lessons that no institution publishes in a glossy quarterly outlook.
What Risk Analysis in Investment Actually Means — Not the Textbook Version
Every finance course defines risk analysis as “the systematic identification, measurement, and evaluation of potential threats to capital and returns.” Fine. But that definition hides the most important truth about risk:
Most investors do not fail because they ignored the right formula. They fail because they felt certain — and certainty is the most dangerous emotion in investing.
Risk analysis, at its human core, is the practice of deliberately forcing yourself to imagine being wrong. It is asking: what happens to my financial life if this investment drops 40% and stays there for three years? Can I hold? Will I panic-sell at the bottom? Do I actually understand what I own?
That is why we are narrowing this guide’s focus to three real investor archetypes and their specific risk blind spots — the return chaser, the overconfident bull, and the paralyzed saver — because risk analysis means something different depending on where you sit.
The Three Investor Profiles That Get Risk Wrong (And Why)
Profile 1: The Return Chaser
This is the most common profile in 2025–2026. Chasing last year’s best performer is statistically one of the worst investment strategies you can execute — yet nearly every retail investor does it at some point.
Morningstar’s 2025 analysis of YieldMax ETFs revealed something stunning: one ETF in the YieldMax COIN series earned a 41.9% annual return — yet its investors collectively lost $35.5 million. How? They piled in after the big gains. They bought the hype, not the entry point. They did zero risk analysis on timing, on capital erosion from the option income structure, or on what a reversal would do to their position.
⚠ Risk analysis lesson: Never evaluate an investment in isolation from when you are buying it. The same asset can be a smart buy or a catastrophic one depending on valuation, momentum, and your entry price.
Profile 2: The Overconfident Bull
This investor has had a good run. The market has been kind. The S&P 500 delivered 24% in 2023 and 23% in 2024. Confidence is high. Risk tolerance conversations start feeling like pessimism. The overconfident bull begins concentrating — cutting diversification in favor of the sectors and names that ‘obviously’ will keep winning.
But here is what they are missing in 2026: the S&P 500’s top 10 stocks now represent roughly 40% of the index’s total value. If you own a passive index fund thinking you are diversified, you are not. You are heavily concentrated in a handful of AI-adjacent mega-caps whose valuations already bake in 14–16% annual earnings growth — a bar so high that even minor disappointment could trigger a meaningful correction.
✔ What to do instead: Periodically run a ‘reverse stress test’ on your portfolio. Ask not what return you need, but what scenario would cause permanent damage — and whether that scenario is plausible.
Profile 3: The Paralyzed Saver
On the other end of the spectrum sits the investor who has read too many headlines and is too scared to invest at all. They keep cash in a savings account yielding 4%, convinced they are being safe. What they are actually doing is accepting inflation risk — the slow, silent destruction of purchasing power.
FINRA’s data shows that holding a diversified portfolio of large-cap stocks for any 20-year period in modern history has significantly reduced the chance of losing principal. The risk of not investing is real. It is just less visible than a falling stock price.
The Seven Investment Risks That Actually Matter (With Real Examples)
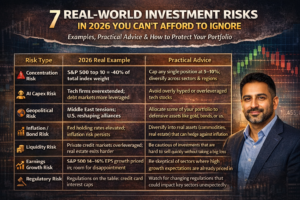
Risk frameworks love to list 12 types of risk. Here are the seven that cause the most real-world damage to real investors, ranked by how often they are underestimated:
| Risk Type | Real 2026 Example | Most Dangerous For | Underestimation Level |
| Concentration Risk | S&P 500 top 10 = ~40% of index weight | Passive index investors | ★★★★★ |
| Behavioral Risk (FOMO/panic) | YieldMax investors losing $35.5M despite 42% fund return | Retail / self-directed investors | ★★★★★ |
| Earnings Expectation Risk | 14–16% EPS growth already priced into 2026 equities | Growth and momentum investors | ★★★★☆ |
| Geopolitical Risk | U.S. trade realignment; Middle East tensions affecting energy | International & EM exposure | ★★★★☆ |
| Inflation / Purchasing Power Risk | Cash savers losing real value as inflation stays above 2% | Conservative / cash holders | ★★★☆☆ |
| Liquidity Risk | Private credit, real estate deals — hard to exit fast | Illiquid alternative investors | ★★★☆☆ |
| Regulatory / Policy Risk | Credit card interest rate cap proposals denting financials | Sector-concentrated investors | ★★☆☆☆ |
A Deeper Look: Behavioral Risk — The Risk Nobody Measures
Every risk management textbook covers market risk, credit risk, and liquidity risk. Almost none of them cover behavioral risk — the risk that you will make an irrational decision at exactly the wrong moment.
A 2024 report by Yodelar found that an increasing proportion of investors are ignoring diversification entirely, chasing recent growth sectors without any asset allocation model. This is not ignorance — many of these investors know diversification matters. They simply cannot feel the risk of a concentrated bet the way they can feel the excitement of a winning one. That asymmetry between how our brains process potential gain versus potential loss is the most expensive bias in personal finance.
The Contrarian View: Most risk management advice focuses on what can go wrong with your assets. The bigger risk, for most investors, is what can go wrong with your decisions about those assets. A perfect portfolio with a panicking investor will underperform a mediocre portfolio held steadily for 20 years.
How to Actually Measure Investment Risk: Tools That Work (And Their Blind Spots)
Here are the key quantitative tools, explained plainly — plus the honest limitations that most articles omit:
Standard Deviation: Useful but Incomplete
Standard deviation measures how much an investment’s returns bounce around its average. A stock with low standard deviation does not swing wildly. A high one might deliver 40% one year and -30% the next.
Blind spot: Standard deviation treats upside volatility the same as downside volatility. An investment that keeps surging irregularly will look ‘risky’ even though the investor is making money. This is why the Sortino Ratio (which only measures downside volatility) is often more useful.
Value at Risk (VaR): The Number Institutions Trust — Carefully
VaR answers: “At a 95% confidence level, what is the most I could lose in a single day?” A portfolio with a 1-day 95% VaR of $50,000 is saying: there is a 5% chance of losing more than $50,000 tomorrow.
Blind spot: VaR is built on historical data. It works well in normal markets. It catastrophically underestimates tail risk — the rare but devastating events like the 2008 financial crisis, COVID-19 crash, or a sudden geopolitical shock. Most banks had low VaR readings right before 2008. This is why institutions combine VaR with Conditional VaR (CVaR) and stress testing.
Sharpe Ratio: Return Per Unit of Risk
The Sharpe Ratio divides your excess return (return minus the risk-free rate) by standard deviation. Higher is better. A Sharpe of 1.0 is considered good. Above 2.0 is excellent. But — a Sharpe Ratio calculated over a bull market tells you very little about what happens when conditions change.
Beta: How Much Your Portfolio Moves With the Market
Beta measures sensitivity to market movements. A beta of 1.3 means your portfolio typically moves 30% more than the market — both up and down. A beta of 0.7 means it moves less. Beta only measures systematic (market-wide) risk — it tells you nothing about company-specific risks, which is why it must always be paired with other metrics.
| Metric | What It Tells You | What It Misses | Best Used For |
| Standard Deviation | Total return volatility | Doesn’t separate up from down moves | Comparing similar asset classes |
| Beta | Market correlation / sensitivity | Company-specific and tail risk | Systematic risk exposure |
| Sharpe Ratio | Return quality per unit of risk | Unreliable in non-normal markets | Comparing fund managers |
| Sortino Ratio | Downside-only risk-adjusted return | Less data; harder to calculate | Loss-averse investors |
| Value at Risk (VaR) | Worst-case loss at confidence level | Severely underestimates tail events | Institutional daily risk limits |
| CVaR / Expected Shortfall | Average loss beyond VaR threshold | Complex; requires modeling assumptions | Comprehensive tail risk analysis |
| Max Drawdown | Worst historical peak-to-trough drop | Historical, not predictive | Understanding emotional durability |
The Risk Analysis Method Most Investors Skip: Scenario Analysis
Scenario analysis sounds complicated. It is not. At its simplest, it forces you to answer: “What would happen to my portfolio if [bad thing] occurred?” This one exercise catches more blind spots than any formula.
Here is a simplified scenario analysis for a typical 2026 investor with a 60/40 portfolio (60% equities, 40% bonds):
| Scenario | Probability | Equity Impact | Bond Impact | $500K Portfolio Impact |
| Base Case: Moderate growth, AI delivers, rates stable | 45% | +10% to +14% | +3% to +5% | +$65,000 to +$91,000 |
| Bull Case: AI boom, strong earnings, low inflation | 20% | +20% to +25% | +1% to +3% | +$106,000 to +$131,000 |
| Correction: Earnings disappoint, sentiment shifts | 25% | -15% to -25% | +4% to +8% | -$58,000 to -$86,000 |
| Stress Case: Recession + geopolitical shock | 10% | -35% to -50% | +6% to +12% | -$138,000 to -$186,000 |
Notice what this table forces you to confront: a 10% probability stress case still results in losses between $138,000 and $186,000. That is not a remote black swan scenario. A 1-in-10 chance means it happens roughly every decade. Can you financially and psychologically survive that loss without selling? If not, your allocation is too aggressive for your actual risk tolerance — regardless of what any risk questionnaire says.
Javeed’s Rule: Run your scenario analysis until you find the number that makes your stomach drop. That is your real risk tolerance — not the one you circled on a questionnaire.
Risk Management in Practice: What Actually Works in 2026
Theory is cheap. Here is what professional and disciplined individual investors actually do:
1. Never Let Any Single Position Exceed 5% of Your Portfolio
One investor who lost a substantial amount early in his career described putting 10–20% of his portfolio into individual stocks. When they went wrong, there was no recovery. After studying the world’s most successful investors, he found that even Jim Simons — the most consistently successful investor in history — caps individual positions at 0.25–0.5%. Most disciplined retail investors cap single positions at 5%.
2. Rebalance When Concentration Exceeds Your Target
Markets drift. A 60/40 portfolio left alone through 2023 and 2024 may now be 75% equities — carrying far more risk than originally intended. Rebalancing is not about timing the market. It is about ensuring your actual risk exposure stays aligned with your intended exposure.
3. Use Stop-Loss Orders for Volatile Positions
A stop-loss automatically exits your position if the price falls to a preset level. Setting one at 15–20% below your purchase price for high-volatility holdings protects against the most common mistake: the investor who ‘plans to sell if it gets bad’ but cannot pull the trigger when it actually gets bad.
4. Hedge the Risks You Cannot Diversify Away
Diversification handles most unsystematic (company-specific) risk. But systematic risk — the kind that hits everything at once — requires hedging. In 2026, Morgan Stanley recommends real assets like gold and energy infrastructure as hedges against inflation risk. For equity-heavy portfolios, small positions in inverse ETFs or put options can limit downside in a severe correction.
5. Match Investment Time Horizon to Risk Type
This is the most overlooked risk management principle among individual investors. Investing money you will need in 18 months into equities is not a risk management decision — it is speculation. Short-term money belongs in instruments with low principal risk. Long-term money can bear more volatility because time is the great equalizer of equity risk.
Case Study: Two Investors, Same Market, Very Different Outcomes (2022–2026)
Consider two investors, both starting with $250,000 in early 2022 — right before the worst bond and stock market environment since 2008.
| Factor | Investor A (No Risk Analysis) | Investor B (Disciplined Risk Analysis) |
| Portfolio allocation | 100% growth stocks / Nasdaq-heavy | 60% diversified equities, 30% bonds, 10% gold |
| Position sizing | 4 stocks averaging 25% each | 25+ positions, none exceeding 5% |
| Scenario analysis done? | No | Yes — prepared for 30% drawdown |
| Stop-losses in place? | No | Yes — 15% trailing stops on volatile positions |
| 2022 loss | -38% (-$95,000) | -14% (-$35,000) |
| Behavioral response | Panic sold in October 2022 (near the bottom) | Held — rebalanced into equities during correction |
| Portfolio value — May 2026 | ~$204,000 (still below start) | ~$368,000 (47% gain from start) |
The performance gap was not created by stock picking genius. It was created by risk analysis done before the money was invested. Investor B knew what a bad scenario looked like. When it arrived, it felt familiar rather than catastrophic. That psychological stability — bought by preparation, not luck — made the difference of over $164,000 over four years.
Contrarian Views on Risk: What the Industry Gets Wrong
Here are three positions that most financial institutions will not say out loud — but that any honest practitioner knows to be true:
Contrarian #1: “Diversification is not always the answer.” — When everything is correlated, diversification provides far less protection than the models suggest. In March 2020 and again in 2022, stocks and bonds fell simultaneously — breaking the most fundamental assumption of a 60/40 portfolio. True diversification requires including assets with genuinely low correlation: commodities, real assets, cash, and sometimes nothing at all.
Contrarian #2: “Risk tolerance questionnaires are nearly useless.” — Answering questions about hypothetical losses in a bull market tells you almost nothing about how you will actually behave during a real 30% drawdown. The only honest risk tolerance test is experiencing a significant loss and observing your own behavior.
Contrarian #3: “The biggest risk for most people is not taking enough risk.” — Institutional risk management is designed to protect against downside. But for an individual with a 30-year investment horizon, the bigger threat is failing to grow wealth at a rate that outpaces inflation and meets retirement needs. Playing it too safe is a very expensive mistake — just a slow-moving one.
Your 6-Step Personal Risk Analysis Checklist
Before committing capital to any investment, work through these six questions:
- What is my worst realistic scenario — and can I survive it? Define the 10th percentile outcome, not just the expected one. Can you absorb that loss financially and emotionally?
- Am I buying this because of evidence or because of recent performance? If your main reason is that it went up last year, that is return-chasing, not analysis.
- What is my position size, and what happens if this goes to zero? No single holding should cause irreparable damage to your portfolio.
- What is my exit plan before I enter? Predetermined stop-losses and price targets remove emotion from the decision.
- How does this investment behave when everything else I own is also falling? Correlation analysis under stress conditions, not normal conditions, is what matters.
- Does my time horizon match this investment’s risk profile? If you might need this money in under three years, equity risk is inappropriate.
The 2026 Investment Risk Spectrum: Where Are You?
Use this framework to assess where your current portfolio sits and whether it matches your life stage and goals:
| Risk Level | Typical Allocation | Expected Annual Range | Suitable For | Key Risk |
| Ultra-Conservative | 100% cash / T-bills | +2% to +4% | Retirees needing capital preservation | Inflation erodes real value slowly |
| Conservative | 20% equities / 80% bonds | +3% to +6% | Near-retirement (5–7 years away) | Inflation + low real return risk |
| Moderate | 50% equities / 50% bonds | +5% to +9% | Mid-career savers (10–20 year horizon) | Short-term volatility; emotional risk |
| Growth | 70% equities / 30% bonds | +7% to +12% | Long-horizon investors (20+ years) | Drawdown endurance required |
| Aggressive | 90–100% equities / alternatives | +8% to +15% (avg) / large swings | Long horizon + high behavioral discipline | Concentration; behavioral failure |
| Speculative | Options / leveraged / single stocks | Unlimited upside / unlimited loss | Experienced only; small % of capital | Total capital loss is possible |
Final Thought: Risk Is Not the Enemy. Ignorance of Risk Is.
Every investor who blew up their account — the 18-month trader who lost his savings, the real estate investors who lost more than they made, the ETF buyers who lost money in a fund that gained 42% — had one thing in common: they did not spend enough time deliberately imagining what wrong looked like before they committed their money.
Risk analysis is not about being afraid to invest. It is about respecting the uncertainty that makes returns possible in the first place. The market rewards risk. But only the risk that was understood, sized appropriately, and held with patience through the inevitable bad periods.
In 2026, with equity valuations stretched, AI spending front-loaded against back-loaded revenues, geopolitical fault lines widening, and behavioral biases amplified by social media and instant trading — risk analysis is not optional. It is the single most important skill a modern investor can develop.
The question is not whether you will face risk. The question is whether you will face it with your eyes open.
Frequently Asked Questions
What is the simplest definition of risk analysis in investment?
Risk analysis is the practice of identifying what can go wrong with an investment, how likely that is, and how bad the impact would be — before committing your money.
Is higher risk always rewarded with higher return?
Over long time horizons and with proper diversification, yes — historically. But poorly understood, poorly timed, or concentrated risk is often punished rather than rewarded.
How is risk analysis different from risk management?
Risk analysis is diagnostic — it identifies and measures risk. Risk management is prescriptive — it decides what to do about it through diversification, hedging, position sizing, and rebalancing.
What is the number one risk mistake individual investors make?
Behavioral risk — making emotional decisions (panic selling, FOMO buying) at the worst possible moment. Morningstar’s research consistently shows investors earn significantly less than the funds they invest in, due to poor timing decisions.
How often should I review my investment risk?
At minimum quarterly, and immediately after any major life change (job, family, health) or major market event (10%+ move in either direction). Risk tolerance is not static.
Can I eliminate investment risk entirely?
No. Risk is inseparable from return. The goal is not elimination — it is selecting and sizing risk intelligently so that the potential reward justifies the exposure.
What is tail risk and why does it matter?
Tail risk refers to the small probability of extreme, outsized losses — the events that standard models like VaR consistently underestimate. The 2008 financial crisis was a tail risk event. Planning for tail risk is what separates robust portfolios from fragile ones.
Is cash a safe investment in 2026?
Cash is safe from nominal loss but exposed to inflation risk. In an environment where inflation runs above savings rates, holding excess cash guarantees a slow loss of purchasing power — a very real but invisible form of investment risk.
What does ‘risk tolerance’ actually mean?
Your real risk tolerance is not what you say you can handle — it is how you actually behave during a significant loss. The most reliable way to discover your true risk tolerance is to hold through a drawdown and observe whether you sleep, sell, or buy more.
What are the top investment risks in 2026 specifically?
The most significant 2026 risks include: stretched equity valuations (14–16% EPS growth already priced in), AI capital expenditure front-running revenue, geopolitical fragmentation accelerating, and behavioral risk amplified by instant trading platforms and social media.
About the Author
Javeed Dhillon is an investment risk analyst and portfolio strategist with over a decade of hands-on experience managing risk across equities, fixed income, real assets, and alternative strategies. He has worked with both institutional and individual investors through multiple market cycles — including the 2020 COVID crash and the 2022 simultaneous equity-and-bond correction. Javeed writes to bridge the gap between institutional risk theory and the real decisions that individual investors face every day.
Disclaimer
This article is for educational and informational purposes only. It does not constitute financial, investment, or legal advice. All investment involves risk, including the possible loss of principal. Past performance is not indicative of future results. Always consult a qualified financial professional before making investment decisions.